This report is analyzing performance parameters of Battery Electric Vehicles (BEVs) in comparison to Internal Combustion Engine (ICE) cars as of 2019-20 in order to evaluate future BEV competitiveness and the rate of penetration into US private vehicle market. In 2019 the number of delivered BEVs in US was at 265,394 units, similar to 271,932 units the previous year. Interestingly, this came in line with a continuing trend of decreasing sales of passenger vehicles in the US. The overall percentage of BEVs from among passenger cars reached 5.5% - a continuing increase from 1.06% in 2016, 1.83% in 2017 and 4.95% in 2018. BEVs formed 80% of Plug-in EVs, clearly showing dominance over PHEVs; in 2018 this share was at 75%. Despite an overall decline of car sales in 2020, BEV and PHEV sales are thought to be less hit upon the pandemic crisis, so BEV percentage can still go up despite an overall number of sold cars going down.
Plug-in electric vehicles have dramatically increased in presence at the private vehicle market in recent years, including hybrid PHEVs and fully-electric BEVs. Due to the aggressive BEVs growth rate compared with other passenger vehicle types, some already assume BEV dominance of the private transportation market within several years. Nevertheless, the transition to electric transportation may still encounter various obstacles, including technology, infrastructures, battery supply and of course regulation. Furthermore, it is also very much possible that the current mainstream scheme of private vehicle ownership could shift to other mobility models, based on technologies such as car-sharing, car-pooling, public transport on demand, autonomous drive, etc.
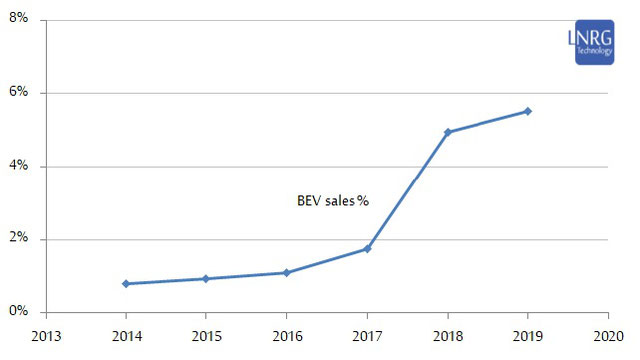
Figure 1. The share of BEVs sales from among annual sales of passenger cars 2014-19 in US. Data obtained from official reports by US government.
In 2019 the number of delivered BEVs in US was at 265,394 units, similar to 271,932 units the previous year. Interestingly, this came in line with a continuing trend of decreasing sales of passenger vehicles in the US. The overall percentage of BEVs from among passenger cars reached 5.5% - a continuing increase from 1.06% in 2016, 1.83% in 2017 and 4.95% in 2018. BEVs formed 80% of Plug-in EVs, clearly showing dominance over PHEVs; in 2018 this share was at 75%. Despite an overall decline of car sales in 2020, BEV and PHEV sales are thought to be less hit upon the pandemic crisis, so BEV percentage can still go up despite an overall number of sold cars going down. This share of sales is beginning to resemble European countries, with a clear trend – BEV dominance in the US market is very likely to be achieved sometime during the 2020s.
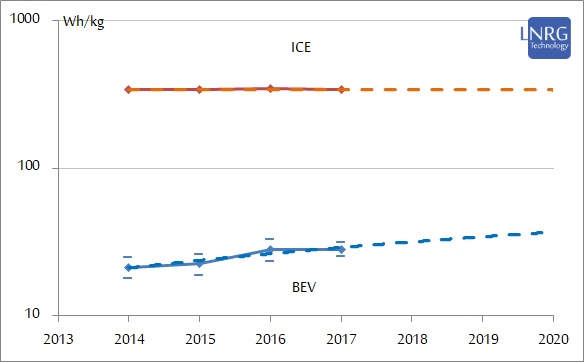
Figure 2. Energy-per-weight (Wh/kg) is equivalent to battery energy capacity per BEV weight in comparison to fuel tank energy capacity per ICE vehicle weight. Energy-per-weight can serve as a tool to measure vehicle's normalized energy capacity.
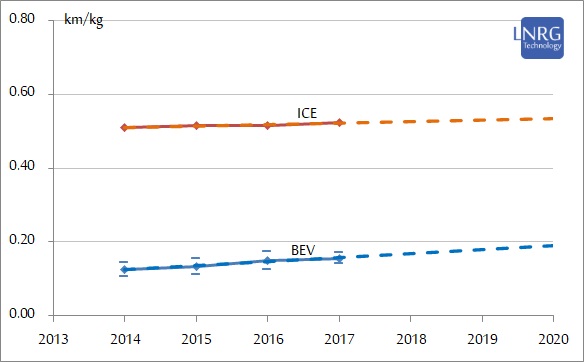
Figure 3. Range-per-weight (km/kg) is equivalent to vehicle's maximum range per BEV weight in comparison to full-tank travel range per ICE vehicle weight. Range-per-weight can serve as a measure for vehicle's normalized travel range.
In conclusion, the analysis of Battery Electric Vehicles (BEVs) versus Internal Combustion Engine (ICE) cars sheds light on the promising trajectory of BEVs in the US private vehicle market. With BEVs forming a growing percentage of passenger car sales, reaching 5.5% in 2019, and continuing to rise despite a decline in overall car sales in 2020, the dominance of BEVs seems increasingly likely. This shift is mirrored by the growing presence of Plug-in Electric Vehicles (PEVs) and suggests a significant transition towards electric transportation in the coming years. However, while the momentum is promising, challenges such as technology, infrastructure, battery supply, and regulation remain to be addressed. Additionally, the emergence of alternative mobility models could further shape the future landscape of private vehicle ownership. As we navigate these transitions, the rise of BEVs marks a pivotal moment in the evolution of the automotive industry, with the potential to redefine the way we move and interact with transportation in the years to come.
The extended commercial report can be purchased at LNRG Technology digital store.