This report is aiming to analyze several performance parameters of BEVs (Battery Electric Vehicles) in comparison to ICE (Internal Combustion Engine) cars in order to evaluate future EV competitiveness and the rate of penetration into the private vehicle market. 2017 was a dramatic year for Plug-in EVs and specifically for BEVs – the number of delivered BEVs in US moved into the six digit area with 111,104 sold units. Interestingly, this came in line with a continuing trend of decreasing sales of passenger vehicles in the US. The overall percentage of BEVs from among passenger cars reached 1.83% - a dramatic increase from 1.06% in 2016 (which was the first year when BEVs surpassed 1% of passenger vehicles sales in US). This analysis utilizes the 2017 annual US sales figures of plug-in electric vehicles published by InsideEVs and technical details of relevant 2017 EV models as rated by manufacturers. In summary, as of 2017, mainstream BEVs took another step in advancing on ICE cars in terms of travel range, while continuing to offer superiority in terms of energy efficiency.
Plug-in electric vehicles have dramatically increased in presence at the private vehicle market in recent years, including hybrid PHEVs and fully-electric BEVs. Due to the aggressive BEVs growth rate compared with other passenger vehicle types, some already assume BEV dominance of the private transportation market within several years. Nevertheless, the transition to electric transportation may still encounter various obstacles, including technology, infrastructures, battery supply and of course regulation. Furthermore, it is also very much possible that the current mainstream scheme of private vehicle ownership could shift to other mobility models, based on technologies such as car-sharing, car-pooling, public transport on demand, autonomous drive, etc. This report is aiming to analyze several performance parameters of BEVs (Battery Electric Vehicles) in comparison to ICE (Internal Combustion Engine) cars in order to evaluate their future competitiveness and the rate of penetration into the private vehicle market.
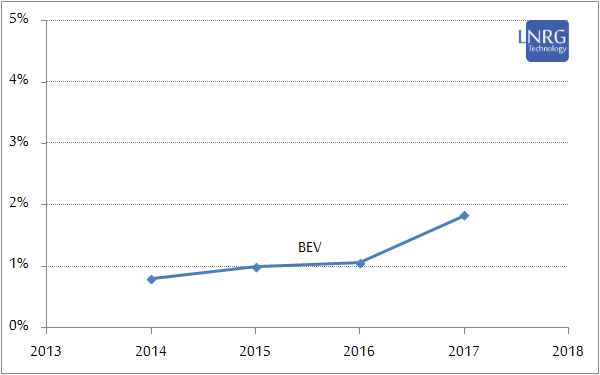
Figure 1. The share of BEVs sales from among annual sales of passenger cars 2014-17. Data obtained from official reports by US government.
2017 was a dramatic year for Plug-in EVs and specifically for BEVs – the number of delivered BEVs in US moved into the six digit area with 111,104 sold units. Interestingly, this came in line with a continuing trend of decreasing sales of passenger vehicles in the US. The overall percentage of BEVs from among passenger cars reached 1.83% - a dramatic increase from 1.06% in 2016 (which was the first year when BEVs surpassed 1% of passenger vehicles sales in US). This share of sales is still far from market dominance in some European countries, but the trend is becoming clear – BEV dominance of the US market is very likely to be achieved sometime during the 2020s.
This analysis utilizes the 2017 annual US sales figures of plug-in electric vehicles published by InsideEVs and technical details of relevant 2017 EV models, as rated by manufacturers. The specs of all fully-electric BEV (Battery Electric Vehicle) models sold in US were utilized for the estimate of weighted average of vehicle's battery energy capacity, vehicle's net weight and vehicle's travel range. PHEVs were not in this study due to the complication of comparing vehicles with two propulsion systems. As for 2017, BEV models sold in US included models of Tesla, Chevrolet, Nissan, BMW, Fiat, Volkswagen, Kia, Ford, Honda, Mercedes, Smart, Hyundai and Mitsubishi. A single ICE (internal Combustion Engine) vehicle was utilized for comparison - the gasoline-powered 2017 model Toyota Corolla. The weighted average and standard deviation of EV performance parameters is depicted at the following charts in comparison to parallel figures of an ICE vehicle, with energy content of gasoline rated in watt-hours for proper comparison.

Figure 2. Energy-per-weight (Wh/kg) is equivalent to battery energy capacity per BEV weight in comparison to fuel tank energy capacity per ICE vehicle weight. Energy-per-weight can serve as a tool to measure vehicle's normalized energy capacity.
Energy-per-weight is addressing vehicle's normalized energy capacity, putting differently sized vehicles on the same scale. We can see that from 2014 to 2017 there had been a notable improvement in weighted energy-per-weight of BEVs, whereas this characteristic for an ICE vehicle has been pretty much stable. Notably, the highest 2017 figure of energy-per-weight for BEVs was obtained by Tesla X with 38 Wh/kg, whereas the lowest figure was by Honda Clarity BEV with 14 Wh/kg; in comparison ICE vehicle typically shows a much higher ratio of over 300 Wh/kg. In 2017, the weighted average energy-per-weight of BEVs remained stable at about 28 Wh/kg. It should be mentioned that some EV manufacturers specify the full capacity of their Li-ion battery, whereas others specify only the usable capacity; for the matter of this study the full capacity was utilized (if available).
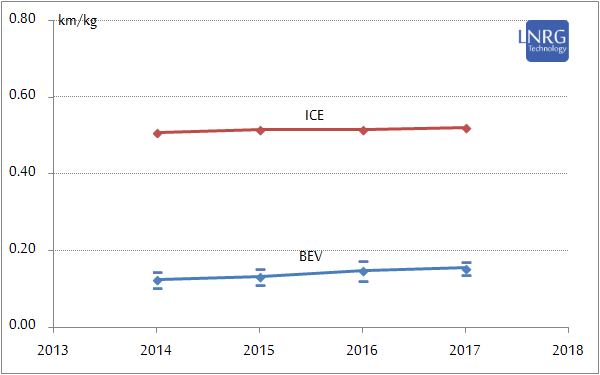
Figure 3. Range-per-weight (km/kg) is equivalent to vehicle's maximum range per BEV weight in comparison to full-tank travel range per ICE vehicle weight. Range-per-weight can serve as a measure for vehicle's normalized travel range.
Range-per-weight is a normalized parameter to compare BEV and ICE vehicles in terms of range, while neutralizing the size factor. The most impressive BEV range-per-weight figure in 2017 was obtained by Tesla Model-3 with 0.22 km/kg, whereas the least range-per-weight was obtained by Mercedes B250e with 0.08 km/kg. BEV weighted range-per-weight ratio rose by 4% in 2017, indicating stronger dominance of BEVs with higher-capacity batteries and longer vehicle travel range. ICE vehicles typically show significantly higher values of range-per-weight, with figures of about 0.50 km/kg, mostly due to a much higher energy content of gasoline fuel tank. The gap between BEV and ICE vehicles in terms of range-per-weight is still significant, but it seems to be rapidly narrowing.
While assessing the transport parity of BEVs, we should take into consideration a much more efficient propulsion system of EVs in comparison to ICE cars on one hand, while on the other hand the energy content of ICE vehicles is still far more superior than the battery energy content of BEVs. Recently, we have been witnessing a growing energy capacity of BEVs, utilizing increasingly better and apparently larger batteries, which had boosted the travel range of EVs to 325km weighted average as of 2017 (compared with 212km in 2014, 232km in 2015 and 296km in 2016), thus rapidly closing the gap with ICE vehicles, which can typically travel 450-700km with a full gasoline tank. The observed increase in EV travel range in 2017 is to a large degree a result of better battery pack performance. This is somewhat different than the conclusion on 2016 increase of travel range, which was largely obtained by incorporation of larger batter packs and heavier vehicles. In summary, as of 2017, mainstream BEVs took another step in advancing on ICE cars in terms of travel range, while continuing to offer superiority in terms of energy efficiency.
The extended commercial report can be purchased at LNRG Technology digital store.