The year 2017 has been characterized by shift of balance in the supply and demand sides - the oil market had experienced a bearish market until early 2016, later taking an upturn and spiking to its biennial record at the end of December 2017. This study aims to provide a careful projection for next year's average oil pricing, utilizing predictive analysis methods. Evidently, predictive analysis cannot provide accurate answers, since we are only speaking of statistical probability, but we can define a high probability range with fair accuracy. Combining predictive analysis models of 10-year and 15-year pricing trends we should expect an average pricing of 60 to 80 USD per oil barrel during 2018. This implies continuation of the positive trend, which makes much sense in light of tighter supply, cold winter in North America and general instability in global geopolitics.
The conventional crude oil sector is an enormous market, with a daily turnover of over 4 billion US Dollars, not including investments and indirect expenses and excluding non-conventional resources. Annual crude oil sales revenue reached nearly 1.5 trillion US Dollars throughout 2017, which is nearly 1.8% of global GDP. Despite decreasing importance of conventional crude oil, it is still making up the lion share of the global energy market. Conventional crude oil is currently at about 73-74 million bpd (about 76-77%) out of total 96 million bpd of liquid fuels, whereas liquid fuels compose some 30% of the primary energy market. Thus, conventional crude oil has significantly dropped from its peak primary energy market share of 50% in the 1970s, but is still critical for global economy. Conventional crude oil is primarily important for the transportation sector, though there is a wide use of oil products for backup power, industrial heating and for electricity production in non-OECD countries. Conventional crude oil is also utilized as a source for oils and polymers in the plastics and cosmetics industries.
2017 has been characterized by balance of the supply and demand sides - the oil market had experienced a bearish market until early 2016, later taking an upturn and spiking to its biennial record at the end of December 2017. With global oil supply and demand closely corresponding, the continuous price increase may be an indication that the oil market will continue seeing a rising trend also in 2018, though several variables might of course interfere. This study aims to provide a careful projection for next year's average oil pricing utilizing predictive analysis methods.
The herewith described price projection is based on the mathematical extrapolation model, which is derived from a 15-year long OPEC basket oil price trend. It is of course an assumption that polynomial trend extrapolation of first, second and third degree is sufficiently accurate to predict oil pricing in the short term of one year or slightly more than that. Such a model can be defined as "non-linear predictive analysis", and it allows us to provide reasonably good projections for a limited time range. This is not a perfect method for financial predictions and is in fact rarely utilized by economists, but is much more objective compared with fundamental analysis and is certainly much more reliable than a simple "business-as-usual" scenario (zero or first degree polynomial fit), which is the dominant, but mostly imprecise, tool in most economic models.
In regard to the previous projection for 2017 based on the 15-year price trend, the most precise result was derived from 2nd polynomial fit, which had a very good correlation with the actual average annual oil price. However, 2016 projection was most accurate with the 3rd polynomial fit and none of the 15-year price trend based projections was close in 2015. Considering relative accuracy for 2016 and 2017 annual projection correlations, there seems to be a certain validity to utilize those for price prediction also in 2018, though better results can be derived from the 10-year price trend model. Using the above assumptions, the same polynomial fits can be applied for average annual oil price data series, in order to produce projections for average annual oil price in 2018.
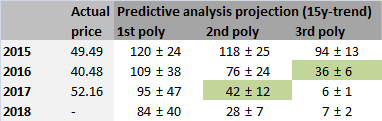
Using the 15-year price trend model - with the 1st polynomial fit, the 2018 result is annual average price of 84 USD per barrel, at R2=0.0897; with 2nd polynomial fit the 2018 result is annual average price of 28 USD per barrel, at R2=0.6892; with 3rd polynomial fit the 2018 result is annual average price of just 7 USD per barrel, at R2=0.7268. Higher polynomial fits can also be utilized, but may not sufficiently add to prediction accuracy with 15-year price trend model. However, combining additional projections based on 10-year price trend model could provide us with more precise tools for estimating future oil pricing.

Figure 1. Annual average OPEC basket oil price during 2002-2017, with mathematical predictive analysis fits of first polynomial, second polynomial and third polynomial degrees to the 15-year price trend of oil.
With such relatively simple mathematical analysis, there is a wide selection of results, ranging from strongly positive direction per first polynomial fit to collapse per second and third polynomial fit with the 15-year price trend model. Evidently, predictive analysis cannot provide accurate answers, since we are only speaking of statistical probability, but we can speak of a high probability range. Combining predictive analysis models of 10-year and 15-year pricing trends we should expect pricing of 60 to 80 USD per barrel during 2018. The projection is referring to the average oil basket pricing of OPEC countries, thus not directly relevant to Brent oil pricing, though there is of course a strong correlation between the two. This implies continuation of the positive trend, which makes much sense in light of tighter supply, cold winter in North America and general instability in global geopolitics.
Clarification
The above presented data is a general informative survey and is not to be considered as a consulting in any way in relevance to capital investment, securities or any other financial instrument. For the avoidance of doubt, the author of this survey is not a certified investment consultant and hence the content of this document is not inclining the readers towards any financial action. It should be emphasized that the reader is recommended to check and verify the content of the above survey prior to obtaining any conclusions of it, since misunderstanding of written material might occur and that there could be unintentional data errors and resulting errors in the analysis. The content of this survey, including every part of it, as well as charts and analyses, are protected by the 2007 Copyright Act of the State of Israel and are not to be used in any way without the explicit approval of LNRG Technology. Charts and images from external sources are utilized in the survey with appropriate licenses; any use of such external charts and images by reader is under the direct responsibility of the reader and under the explicit conditions of the relevant author.
The extended commercial report can be purchased at LNRG Technology digital store (below).