Over the past decade, battery electric vehicles (BEVs) have been steadily increasing their grasp on the private vehicle market. While BEV sales still constitute less than 0.5% of total US private vehicle sales, with a similar share taken by plug-in hybrids, some already predict BEV domination of the private transport market within several years. Nevertheless, the transition to electric transportation may still encounter various obstacles, including technology, infrastructures, battery supply and of course regulation. Furthermore, it is also very much possible that the current mainstream scheme of private vehicle ownership could shift to smart mobility models (car-sharing, car-pooling, public transport on demand, autonomous drive, etc.). This report is aiming to analyze several performance parameters of battery electric vehicles in comparison to internal combustion cars in order to evaluate future EV penetration into the private vehicle market.
This analysis has been performed utilizing the 2015 annual US sales figures of plug-in electric vehicles, published by Cleantechnica, and technical details of relevant 2016-branded EV models as rated by manufacturers. The top ten full-electric vehicle models (in terms of US sales) were used for the estimate of weighted average of battery capacity per vehicle, vehicle's net weight and vehicle's travel range. Hybrid plug-in electric vehicles were disregarded due to the complication of comparing vehicles with two propulsion systems. As for 2015, those BEVs included Tesla S, Nissan Leaf, BMW i3, Fiat 500e, Volkswagen e-Golf, Chevy Spark EV, Mercedes-B EV, Ford Focus EV, Smart ED and Kia Soul EV. A single ICE vehicle was utilized for comparison - a gasoline-powered Toyota Corolla. The weighted average with standard deviation of EVs is depicted at the following charts in comparison to parallel figures of ICE vehicles, with energy content of gasoline rated in watt-hours for proper comparison.
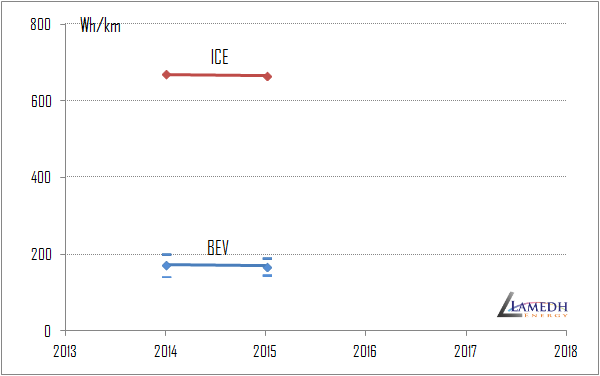
Figure 1. Battery energy content or fuel capacity (Watt-hours) per vehicle range (km) of battery electric vehicles in comparison to an ICE car (represented by Toyota Corolla). Energy-per-range can serve as a tool to measure vehicle's energy efficiency.
Energy-per-range is basically equivalent to the "mpg" (miles-per-gallon) rating of vehicles, describing no other but fuel efficiency. We can see that from 2014 to 2015 there had been some improvement in weighted energy-per-range of BEVs. Notably, the best 2015 figures of energy-per-range for BEVs were obtained by Smart ED with 121 Wh/km, whereas the worst performance was by Ford Focus Electric with 189 Wh/km; in comparison ICE vehicles show a much worse performance of above 600 Wh/km, which has however shown improvement over the past decade. It should be mentioned that some EV manufacturers specify the full capacity of their Li-ion battery, whereas others specify only the usable capacity; for the matter of this study the full capacity was utilized (if available).
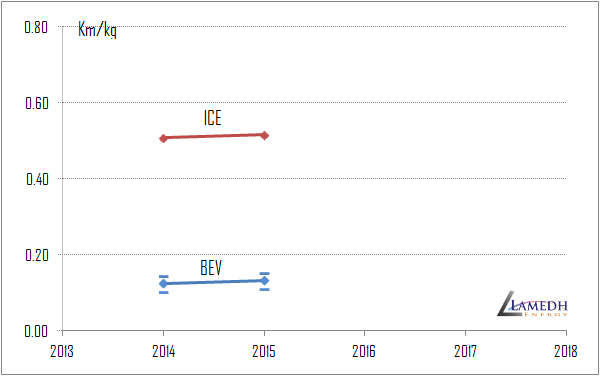
Figure 2. Vehicle maximum range (km) to vehicle net weight (kg) of BEVs in comparison to an ICE vehicle. The range-per-weight can serve as a measure for comparison of normalized travel range.
The range-per-weight is a fair parameter to compare BEV and ICE vehicles in terms of range, while neutralizing the size factor. The most impressive vehicle range-per-weight in 2015 was held by Tesla Model-S with 0.19 km/kg, whereas the least range-per-weight was obtained by Ford Focus Electric with just 0.07 km/kg. BEV weighted range-per-weight ratio rose from 2014 to 2015, indicating stronger dominance of BEVs with larger batteries and thus longer vehicle range, such as Tesla Model-S. Internal combustion vehicles typically show significantly higher values of range-per-weight, with values of about 0.50 km/kg, mostly due to a much higher energy content of gasoline fuel tank. The gap between BEV and ICE vehicles in terms of range-per-weight is still too significant to bridge it in the near term.
Trying to analyze the "transport parity" of battery electric vehicles (BEVs), on one hand we notice a much more efficient propulsion system of battery electric vehicles (BEVs) in comparison to internal combustion engines (ICEs), while on the other hand the fuel energy content of ICE vehicles is far more superior than the battery energy content of BEVs. Recently, we can witness a growing energy capacity of BEVs with increasingly better and apparently larger batteries, which boost the range of electric vehicles to 232km weighted average in 2015 (compared with 212km in 2014), thus slowly closing the gap with internal combustion vehicles which typically can travel 450-700km. However, despite the seeming increase in vehicle range, this is mostly a result of larger battery packs and thus also heavier vehicles, in parallel with a mediocre increase in terms of range-per-weight. In summary, as of 2015, mainstream BEVs still seem to be largely non-competitive with the common ICE cars, but do offer superiority in terms of energy efficiency. The above presented trends of energy-per-range and range-per-weight thus allow us to compare the normalized progress of BEV cars in reference to ICE cars.
The extended commercial report can be purchased at LNRG Technology digital store (below).